Do I need charting software? Not strictly, but charting software is highly recommended to visualize markets and turn raw data into actionable setups.
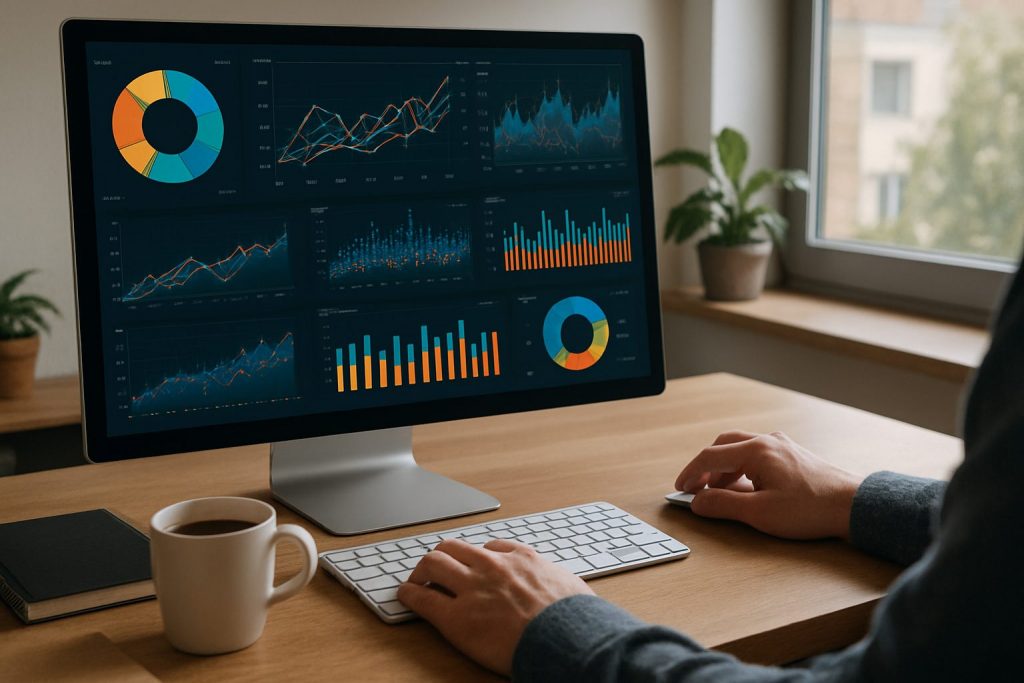
The world of trading often looks like a sea of numbers until it’s transformed by data visualization and graph tools into clear opportunities. For traders focused on price action, a reliable charting platform answers core charting needs: fast data analysis, repeatable chart creation, and clean data presentation. This guide lays out why charting matters, how to match software features to a trading style, and the practical tech choices that keep a setup resilient — from monitors to backup machines. It also shows how to combine visual analytics with screening and fundamental checks so a solo trader or small desk can stay nimble. Expect concrete lists, a comparative table of leading charting tools, a few short case examples, and short takeaways that close each section with a clear insight about what to do next.
Do I need charting software to trade effectively?
Most traders don’t need charting software to place a basic trade, but they do need it to trade consistently. Charting software turns tick and candle noise into patterns and probabilities.
- Visual analytics speed interpretation of price moves and reduce cognitive load.
- Graph tools (trendlines, fibs, indicators) make setups repeatable and teachable.
- Data presentation helps review trades and improve strategy via post-trade analysis.
Example: a swing trader who relies on trendline breaks will lose edge without clear chart creation and replay tools; a scalper needs low-latency charts and rapid visual analytics. The insight: pick software that matches the timeframe and decision speed of the strategy.
Which software features matter most for different trading styles?
Not all charting platforms are equal. The right mix of software features depends on whether the trader is scanning the market, executing short-term setups, or studying fundamentals alongside price.
Essential features for active/short-term traders
Active traders prioritize speed and precision in data analysis and ordering of tools.
- Real-time or near-real-time data and fast redraws.
- Custom indicators and drawing tools for rapid decision-making.
- Multi-chart layouts to monitor correlated markets.
Case: a day trader who uses two charts per symbol (1-min and 5-min) benefits from platforms with multi-layouts and quick template switching. The insight: speed and customization trump breadth if scalping or day trading.
Essential features for swing/position traders
Longer-horizon traders need robust data visualization for context and durable backtesting features.
- Multiple timeframe analysis and template-based workflows.
- Historical transformations (drawdowns, cumulative performance).
- Fundamental overlays if combining valuation with technicals.
Example: comparing a stock’s long-term relative strength alongside macro series clarifies risk. The insight: pick platforms that make multi-panel and cross-asset comparisons effortless.
Which charting platforms are worth considering for visual analytics?
An effective selection balances visual analytics, coverage, and cost. Below is a concise comparison of leading platforms to match a trader’s charting needs.
| Platform | Best for | Key strengths | Starter pricing |
|---|---|---|---|
| Koyfin | Multi-asset research | Fundamentals + technicals + macro dashboards | Free; paid from $39/mo |
| TradingView | Active traders & script community | Fast web charts, many indicators, Pine scripting | Free; paid from $12.95/mo |
| TrendSpider | Automated technical analysis | Auto trendlines, pattern detection, backtesting | Paid only; higher-tier pricing |
| Stock Rover | Fundamental investors | Deep financial metrics and portfolio research | Paid plans from ~$7.99/mo |
| Finviz | Quick screening & heatmaps | Fast market scans; great idea-generation | Free; Elite ~$39.50/mo |
| Yahoo Finance / StockCharts | Casual checks & classic technical charts | Accessible charts, basic indicators, global tickers | Free; paid tiers available |
- Choose Koyfin for integrated fundamentals and multi-asset context.
- Choose TradingView for flexible web charts and community scripts.
- Choose TrendSpider to automate repetitive technical work.
The insight: start on a free tier to test workflow, then upgrade only for the features that materially speed or improve decisions.
Practical tech and resilience: what hardware and connectivity do charts require?
Charting is software, but hardware and networking shape reliability. The right setup reduces interruptions and keeps data visualization accurate during critical moments.
- Display: multiple monitors improve situational awareness — see why professionals often use several screens: how many monitors do professional day traders use?
- Computer: a modest modern machine suffices for browser-based charts; guidance on device choices: is a cheap Windows laptop good enough for day trading? and is a MacBook good for day trading?
- Backups: plan a secondary computer or device: do I need a backup computer for day trading?
- Internet: stable high-speed internet matters; read more at do I need high speed internet for day trading?
- Connectivity alternatives: in some situations 4G can work; see can I day trade with 4G?
- OS flexibility: if using Linux or a Chromebook, check compatibility: can I day trade on Linux? and can I day trade on a Chromebook?
Example: a trader who lost a morning due to a laptop failure avoided disaster by switching to a phone-based chart on a secondary account. The insight: redundancy and a cheap secondary device beat zero backups every time.
Workflow and stack: combining tools to cover every need
Pros rarely rely on a single app. A practical stack uses complementary tools for screening, charting, and research — each optimized for a specific task.
- Screening layer (fast idea generation and heatmaps) — use quick visual screeners to shortlist names.
- Charting layer (trade-level analysis and templates) — a dedicated charting platform for setups and backtests.
- Research layer (fundamentals, macro, portfolio) — integrate multi-asset dashboards for context.
Case study: a hypothetical trader named “Maya” uses a screener to surface candidates each morning, analyzes setups on a charting platform, and logs trades in a simple spreadsheet for monthly review. That routine scales because each tool does one job well. The insight: build a small, consistent stack instead of chasing one “all-powerful” app.
Common questions to close practical doubts
Do beginners need paid charting software?
Beginners can start on free tiers; paid plans are useful only when a feature (real-time data, automation, deeper history) directly improves decision speed or edge.
Can charting software replace learning market structure?
No. Charting tools amplify skill but cannot replace the discipline of reading price and managing risk. Use charts to practice and validate patterns.
Is cloud/web-based charting reliable enough?
Yes, modern web platforms are stable and convenient. Still, maintain a backup device and connection to avoid outages during critical periods.
Which platform best handles both fundamentals and technicals?
Koyfin stands out for combining fundamentals, macro series, and technical charts into one workflow, reducing the need to switch between apps.
How to choose between automation and manual analysis?
Automation (pattern detection, scanners) saves time but requires verification. Start by manually validating automated signals before trusting them with real capital.
Final practical checklist
- Define the trading timeframe and map required software features.
- Test free tiers for at least two weeks to prove the workflow.
- Ensure basic hardware redundancy and reliable internet connections.
- Log trades and use charts to improve decisions over time.
The last thought: charts are a translator between raw market data and human decisions. Choose tools that let that translation be clear, fast, and repeatable.
Questions traders often ask
How much does good charting software cost?
Entry-level charting can be free; meaningful paid plans start from roughly $12–$40/month for popular platforms, while advanced automation tools can cost more.
Can charting software run on a Chromebook or Linux?
Many web-based charting platforms run on Chromebooks and Linux; check specific tool compatibility and have a fallback device in case of occasional issues.
Is multiple-monitor setup necessary?
Multiple monitors are helpful but not mandatory. A single large monitor with well-organized layouts can suffice for disciplined traders.

With over a decade of experience navigating global financial markets, I specialize in identifying trends and managing risk as a professional trader. My passion for economics drives my daily commitment to staying ahead in this fast-paced industry. Outside of the markets, I enjoy exploring technology like cryptocurrencies and new investment strategies.