
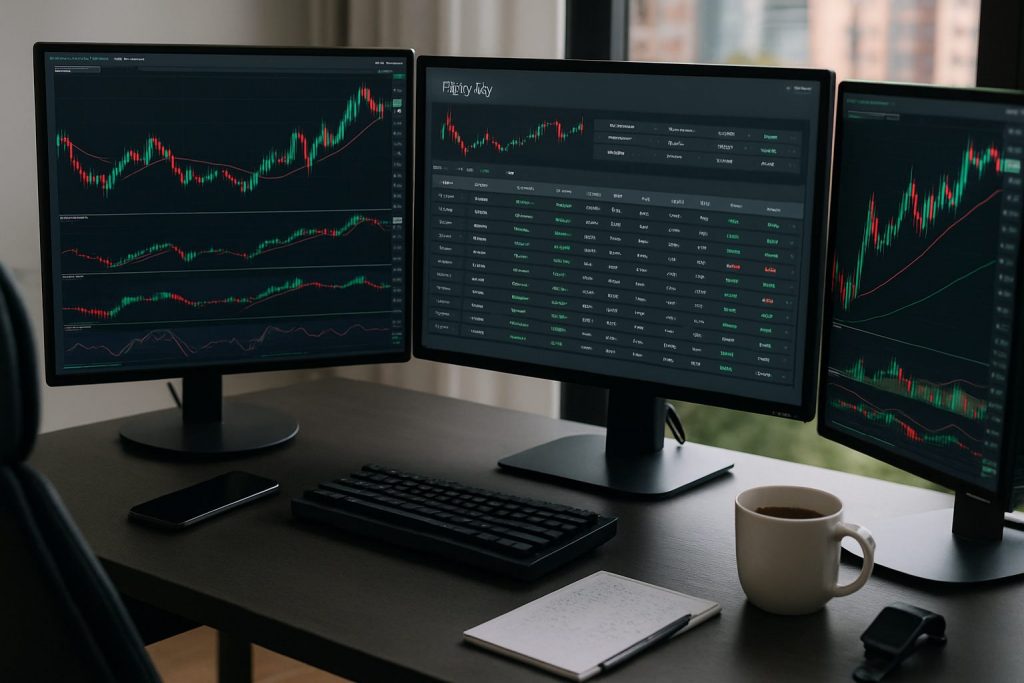
Do I need Excel for day trading logs? No — Excel is a powerful option for day trading logs but it is not strictly necessary for maintaining accurate trading logs.
Do I need Excel for day trading logs? Many traders seek a clear system to record trades, monitor performance, and learn from mistakes. A structured trade journal—whether built in Excel, Google Sheets, Notion, or a dedicated app—turns raw trades into meaningful trade analysis. The goal is to capture financial records, data tracking, and performance metrics (win-rate, reward:risk, efficiency) so patterns and improvement areas become obvious. For example, a fictional retail forex trader named Alex used a simple spreadsheet at first, then tested connected software and a manual hybrid; the result was the same: clear insights and better discipline. This piece compares spreadsheet software to alternatives, shows essential metrics to track in a day trading log, and offers practical steps to build a reliable investment tracking system without relying solely on Excel.
Excel vs alternatives for day trading logs — spreadsheet software and trade journal choices
Excel offers flexibility for custom formulas, automated calculations, and complex performance monitoring. Still, alternatives can provide faster setup or automated imports for those who prefer less manual work.
- Use Excel for bespoke formulas, pivot tables, and deep trade analysis.
- Choose Google Sheets for cloud access and easy sharing.
- Pick a dedicated trade journal app for automatic imports and dashboards.
| Tool | Strengths | Best for |
|---|---|---|
| Excel | Advanced formulas, full control, offline use | Traders who value customization and complex metrics |
| Google Sheets | Cloud access, collaboration, templates | Traders needing portable data tracking |
| Dedicated journal apps | Auto-imports, visual dashboards, less manual entry | Traders who prefer automation over building spreadsheets |
Practical tip: test a simple spreadsheet for two weeks to see which metrics matter most, then decide whether to scale to Excel or an app. This clarifies the trade-off between control and convenience.
When Excel is the better choice for day trading logs
Excel shines when specific financial records and tailor-made reports are needed. Complex trade analysis—such as custom R:R calculations or multi-month efficiency tracking—is easier to implement.
- Requires advanced formulas (R won, R lost, Efficiency).
- Need for printable monthly reports and backups.
- Desire to integrate screenshots and custom metrics.
| Feature | Excel Capability |
|---|---|
| Custom metrics (Efficiency, Actual R) | Fully supported with formulas and manual inputs |
| Large datasets | Handles many rows, pivot summaries |
Insight: when the priority is bespoke performance monitoring, Excel remains a top choice for disciplined traders.
How to keep a day trading log without Excel — build a trade journal from scratch
Manually entering every tick is unnecessary. A focused trade journal records the essentials each day: number of trades, wins/losses, R values, net profit, and a screenshot link. Alternatives to Excel can automate parts of this workflow and still preserve control.
- Capture basic stats: date, starting balance, # of trades, wins, losses.
- Record R metrics: R Won, R Lost, Avg R Win/Loss, Reward:Risk.
- Save a daily screenshot link to preserve context and notes.
| Minimum fields | Why it matters |
|---|---|
| Date, Starting balance | Establishes timeline and relative performance |
| # trades, Wins, Losses, Win Rate | Core success metrics for trade analysis |
| Profit $, Fees, Net Profit | Real money results and costs |
| Screenshot link, Notes | Context for behavioral review and missed opportunities |
Many day traders pair a lightweight spreadsheet with a screenshot folder and a short evening review. For those exploring automation, consider whether importing trades from the platform or keeping manual entries better supports learning. Learn about automation and tools at do I need AI tools for day trading and balance technology with deliberate practice.
Practical non-Excel setups and routines
Alternatives can be combined into a hybrid routine that keeps the best of both worlds: speed and structure. A simple evening checklist creates lasting improvements.
- Use a cloud note or Google Sheet for daily metrics and a screenshot link.
- Keep a monthly master file (spreadsheet or app) that aggregates daily entries.
- Perform a weekly review to compute efficiency and adjust the plan.
| Routine step | Tool example |
|---|---|
| Record daily metrics | Google Sheets or simple CSV |
| Store screenshots | Cloud folder + shared link |
| Weekly analysis | Spreadsheet summary or trade journal app |
Insight: a consistent routine trumps a perfect tool — choose systems that are actually used every day.
Essential metrics for day trading logs — performance monitoring and trade analysis
Tracking the right metrics transforms a list of trades into a roadmap for improvement. Beyond wins and losses, the crucial figures are Reward:Risk, Efficiency, and Profit expressed in both R and percent.
- Win Rate and R:R reveal whether the edge exists.
- Efficiency measures how well the plan was executed relative to potential.
- Time Traded lets traders calculate an hourly performance figure.
| Metric | Definition | How it helps |
|---|---|---|
| Win Rate | # wins / # trades | Assesses consistency of entries |
| Average R Win / Loss | R won ÷ # wins ; R lost ÷ # losses | Measures trade sizing vs reward |
| Efficiency | Profit R / Potential R | Shows execution quality vs plan |
| Profit % and Actual R | Net Profit ÷ Starting Balance; Net Profit ÷ R | Connects risked capital to returns |
Example: if a trader could have made 5% by following the plan but actually made 3%, efficiency is 60% — a clear signal to refine execution and patience. For connectivity and setup questions that affect data capture, see do I need high-speed internet for day trading and is wired internet better than Wi‑Fi for day trading.
Implementing metrics: examples and checklist
Use this checklist to ensure consistent entries and reliable investment tracking.
- Enter starting balance and risk per trade (R) each day.
- Log number of round-trip trades, wins, and losses immediately after the session.
- Add screenshot link and short notes about missed or executed setups.
- Calculate R Won, R Lost, Profit R and Potential R weekly.
| Daily entry | Who it’s for |
|---|---|
| Starting balance, # trades, wins/losses, Net Profit | Every trader doing daily review |
| Screenshot link and notes | Behavioral review and coaching |
| Efficiency and Potential R (manual) | Understanding execution vs plan |
For traders using mobile or alternative setups, check guides on connection reliability and devices: mobile internet, Wi‑Fi, and device choices like MacBook suitability or using Linux (can I day trade on Linux).
Final insight for traders: the choice of tool is secondary to disciplined logging, honest review, and incremental adjustments based on the metrics. Whether using Excel or a lightweight alternative, consistent data tracking and nightly reviews build lasting edge.
Practical downloads and resources for day trading logs
Templates and examples accelerate adoption. Downloadable Excel day trading logs can include monthly tabs, pre-built formulas for R metrics, and example trade pages to learn from. Many templates auto-calculate results from a few manual inputs.
- Look for templates that compute Profit R, Efficiency, and averages automatically.
- Prefer templates with a screenshot link column to preserve trade evidence.
- Keep a habit of deleting blank rows to avoid #DIV/0! Excel errors in formula columns.
| Resource | What it provides |
|---|---|
| Downloadable day trading log (Excel) | Monthly tabs, auto-calculated stats, example trades |
| Hybrid cloud templates | Accessible anywhere, easy to share for coaching |
For setup extras like monitor counts or desktop needs, explore posts on hardware and workspace: how many monitors and whether a desktop is essential (desktop PC).
Note: This content avoids broker recommendations beyond allowed mentions; focus remains on process and metrics for building durable trading habits.
Common questions about Excel and day trading logs
Do beginners need Excel to start a trading log? Beginners do not need Excel to start; a simple notebook or Google Sheet with the core fields (date, # trades, wins/losses, net profit, screenshot link) is sufficient to build discipline and begin trade analysis.
Can metrics be automated instead of entered manually? Yes; some programs connect to accounts and auto-import trades, but manual entry preserves qualitative notes and can capture metrics that automated tools miss, such as subjective efficiency ratings.
How often should the trading log be reviewed? Daily entries with a weekly review are recommended. Monthly aggregation of financial records reveals trends and supports adjustments in risk management.
Is Excel better than an app for performance monitoring? Excel offers unmatched customization for in-depth performance monitoring, while apps provide convenience and automated dashboards. The best choice depends on whether customization or automation is the priority.
Will internet and device choice affect logging? Yes — reliable connectivity and a stable device help capture screenshots and import data. See guides on internet and device suitability, including high-speed internet, wired vs Wi‑Fi, and mobile options (mobile internet).

With over a decade of experience navigating global financial markets, I specialize in identifying trends and managing risk as a professional trader. My passion for economics drives my daily commitment to staying ahead in this fast-paced industry. Outside of the markets, I enjoy exploring technology like cryptocurrencies and new investment strategies.